Your dashboard has been updated
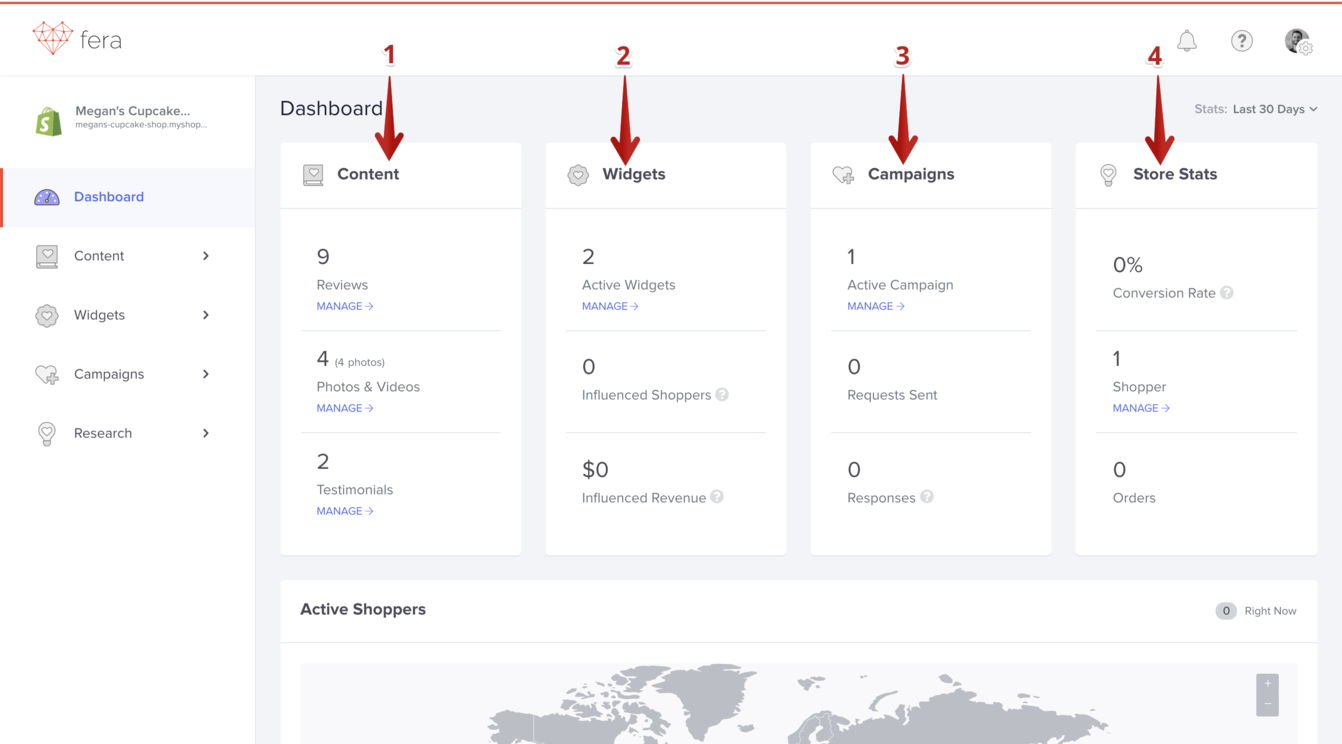
We just updated your dashboard and we couldn't be happier! This latest update is not only aesthetically pleasing, but it allows you to easily see how the Fera Social Proof app is influencing your revenue and conversion rate at a glance. Not only that, but we have added functionality that will help you gather, manage and display your social proof!Here is a rundown on the new features
- Your store content at a glance
- How Your Widgets Have Influenced Your Orders
- View the stats of your campaigns
- Your overall store stats

See your store performance at a glance
Now you can see the overall performance of your store at a glance. We just show you the important information like- Unique Shoppers
- Orders
- Current Conversion Rate
View all your social content
We will show you all the widgets you have running in your store and indicate their status with a colour coded dot.Here is that the colors mean:
- Green: This widget is active and running on your store
- Yellow: Your widget is in the testing phase (learn more about A/B testing here)
- Dark Grey: The widget is in draft
- Light Grey: This widget is inactive
See how your content influences your revenue
The most important part of the new dashboard is the performance section. This section will help you determine how useful Fera is for your online store. You will be able to determine how many orders Fera influenced and how many shoppers saw your social proof content.
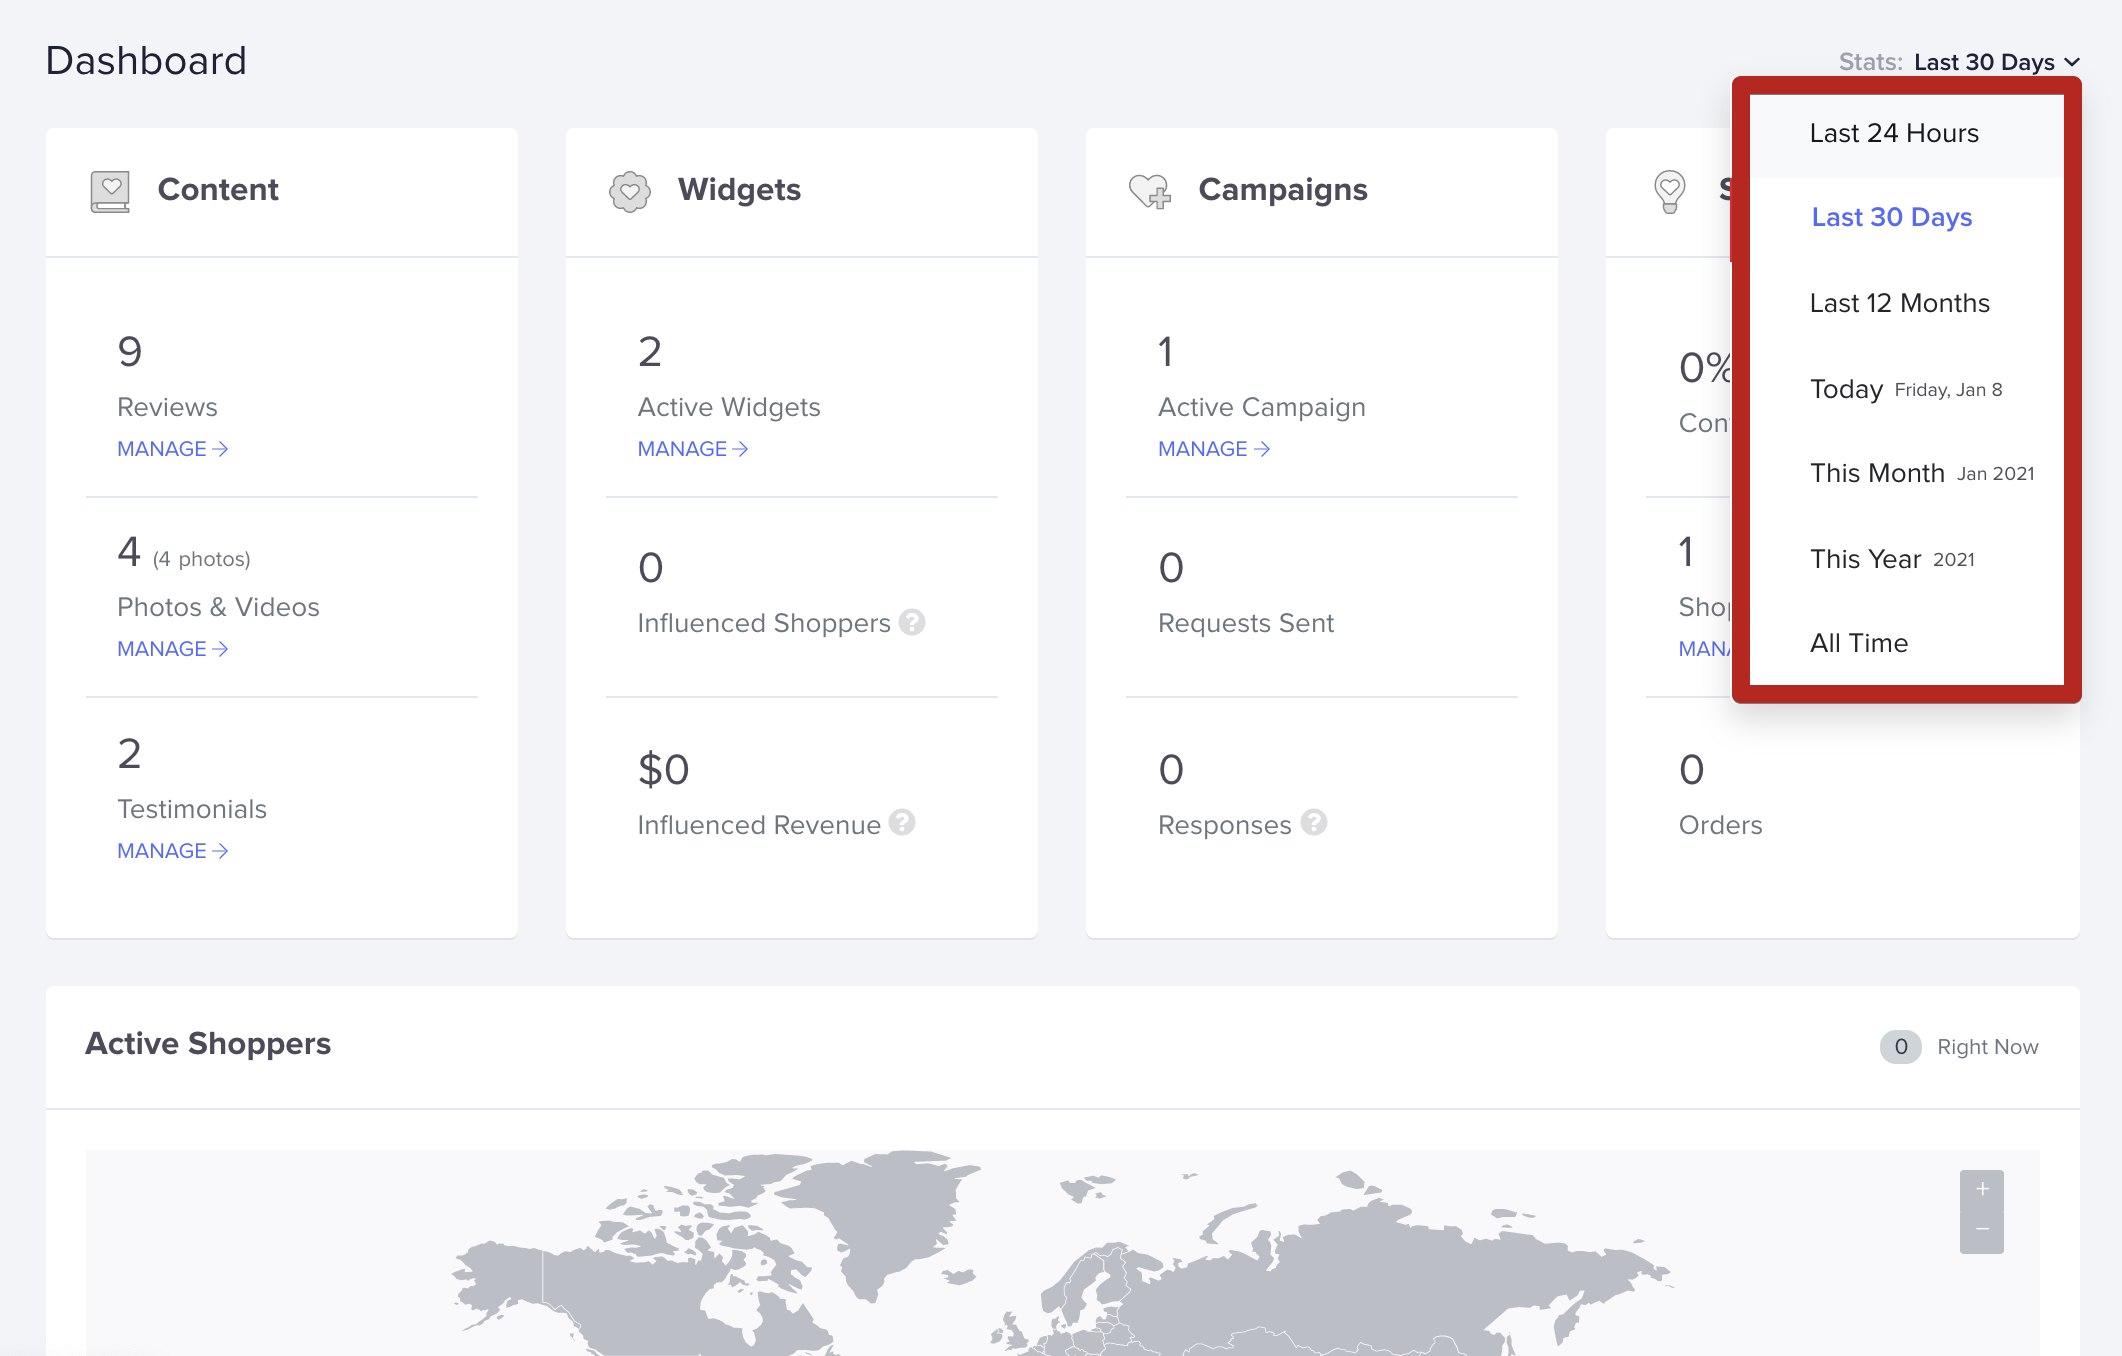
Easily view your historical stats
You can also view your historical statistics by- Day
- Month
- Year
- All-time

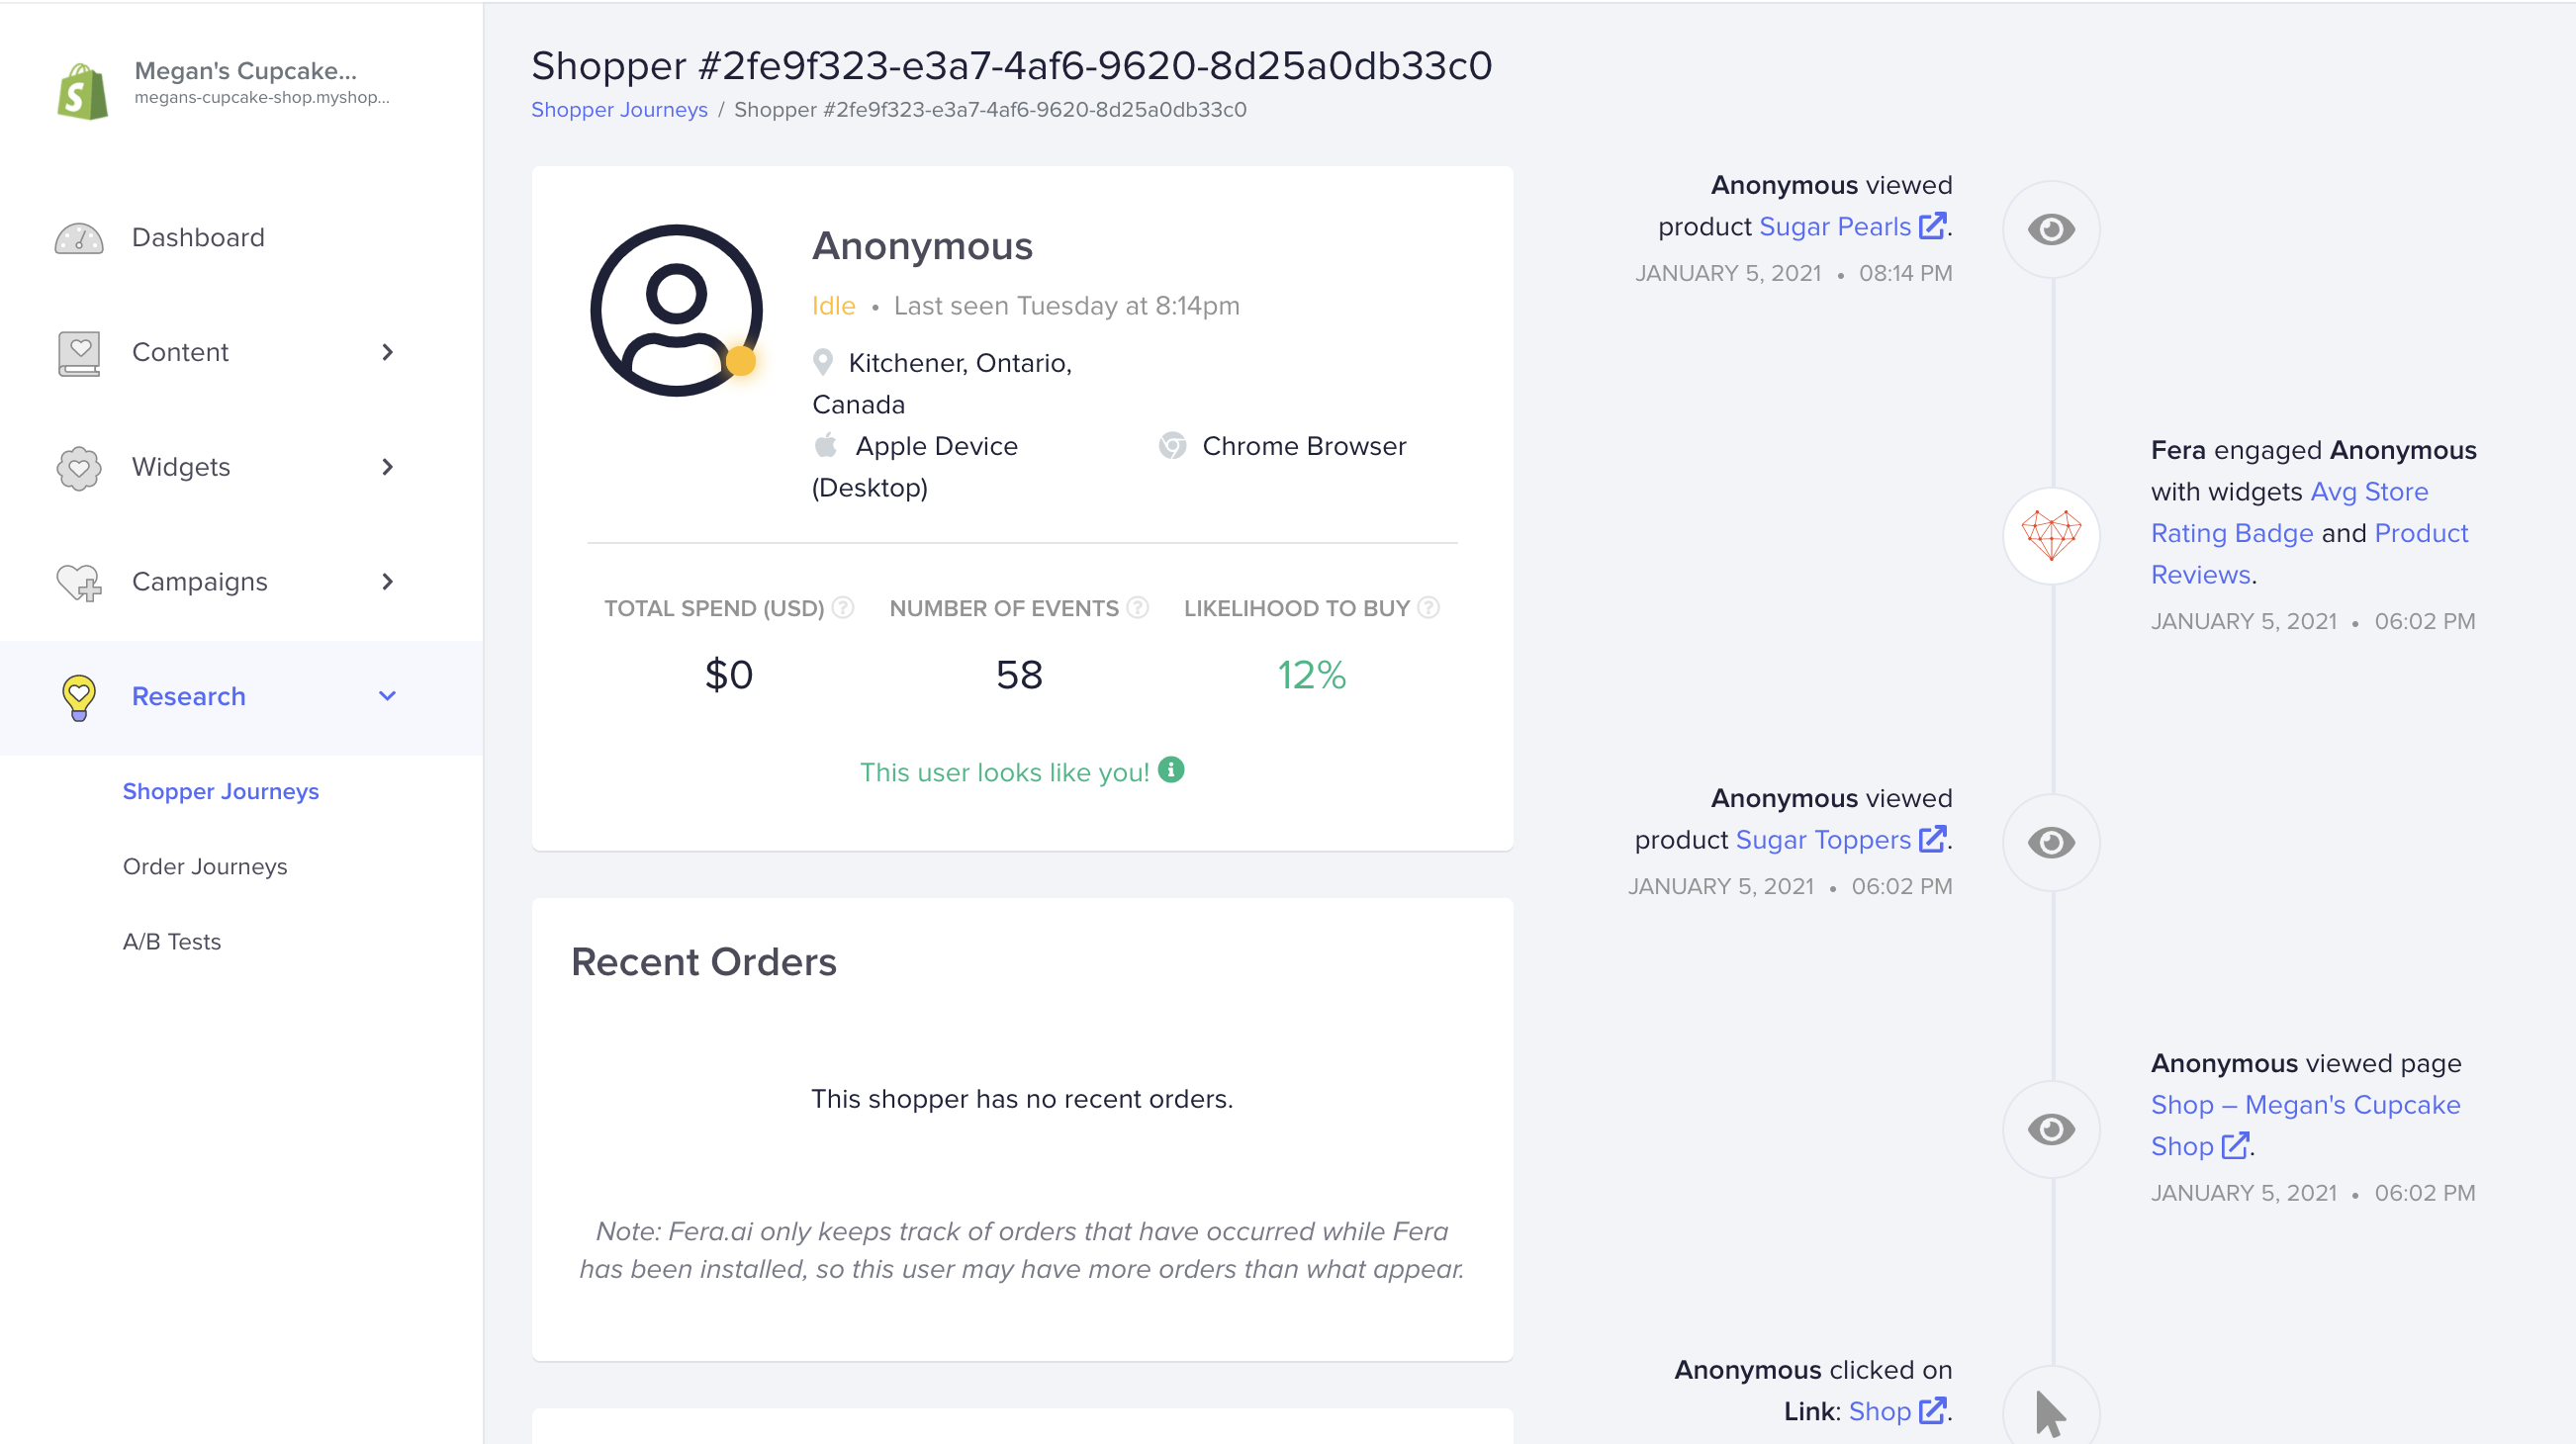
- where in the world your customers are
- what type of device they are using
- their operating system
- how many actions (events) they took on your site
- their likelihood to buy from you
- every page they have visited
- which Fera widgets they interacted with

All this information will help you understand where your customers are coming from, what they are looking at and what type of social proof they are interacting with.


